Accounting Dashboard
Access Accounting Dashboard
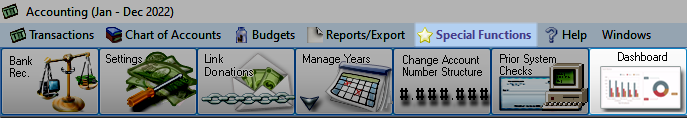
To access from the Button Bar, go to Special Functions > Dashboard.
Dashboard Display Controls
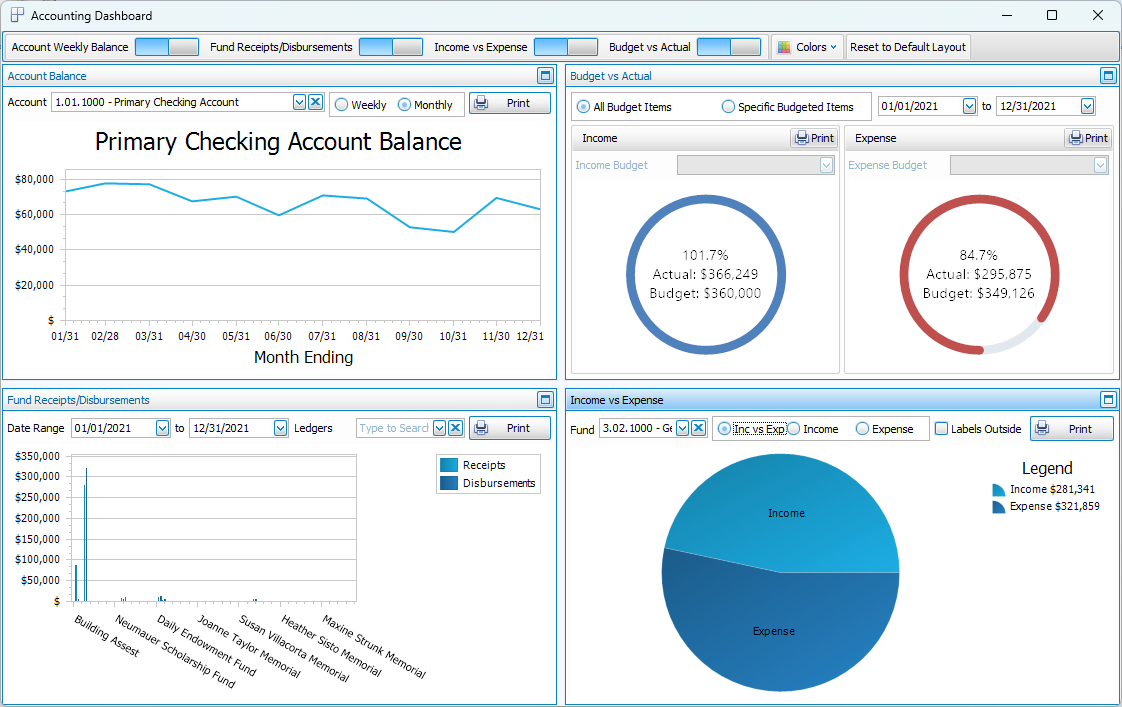
Across the top of the dashboard are several toggle switches that turn display for a graph on or off. Any toggles that don't fit can be accessed by clicking the down arrow at the end of the row.

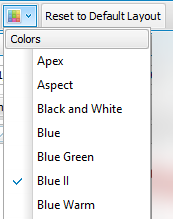
With the Colors menu, select a color scheme to apply to graphs.
Use Reset to Default Layout to return the dashboard to its original setup.
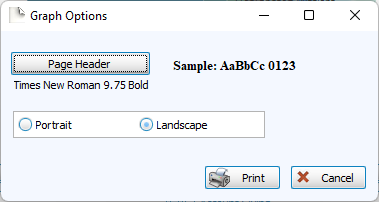
Click Print to view a Print Preview and send the selected graph to your printer. Control fonts and page orientations from the Graph Options window. You can also Exports graphs or Exports from the Print Preview window.
Graphs
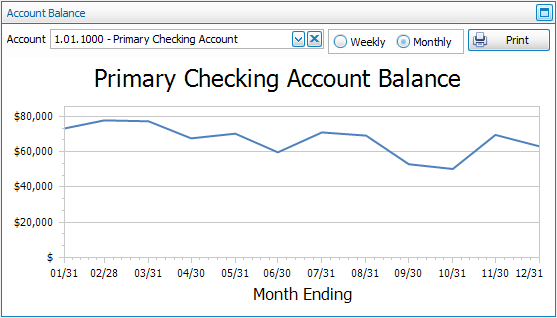
Account Balance
Select any of your accounts from the dropdown to see a simple line graph of the Weekly or Monthly account balance from the beginning of the accounting year through today.
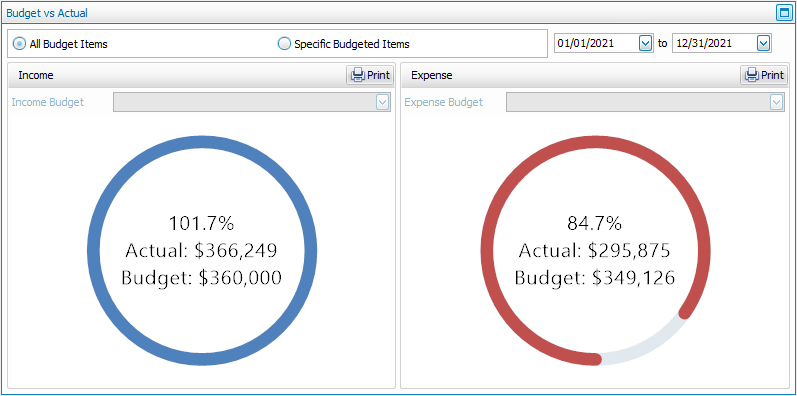
Budget vs. Actual
Select a date range in the top right to compare actual Income and Expense amounts to your Budgets for all or specific budgets.
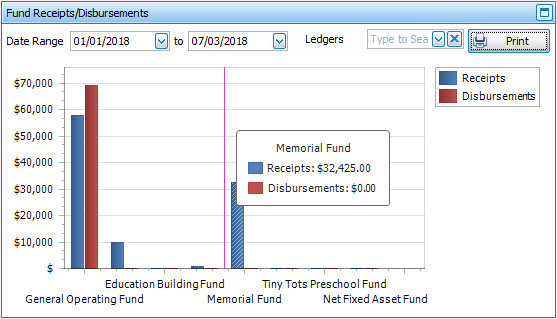
Fund Receipts/Disbursements
This bar graph compares the Receipts and Disbursements for each fund with the date range in the upper left. You can also select a single fund from the Ledgers dropdown.
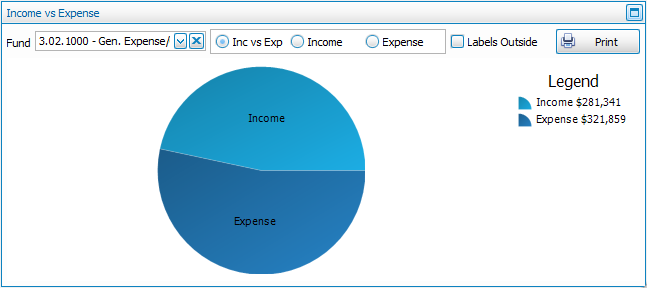
Income vs. Expense
This pie graph provides three display choices for your Funds. Select a Fund from the dropdown and choose to display Income vs. Expenses or a breakdown of Income or Expenses.